First Dashboard PowerPoint Template

First Dashboard PowerPoint Template: Your One-Stop Shop for Data Visualization (30 Slides)
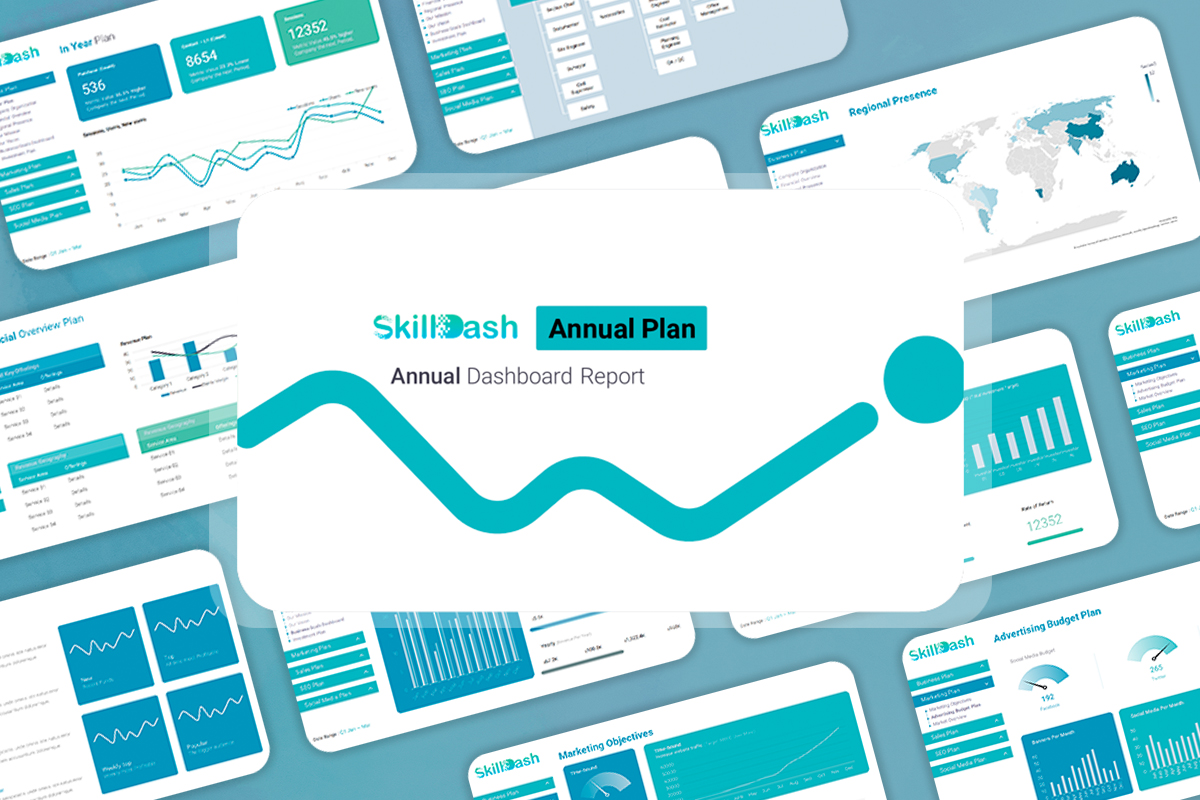
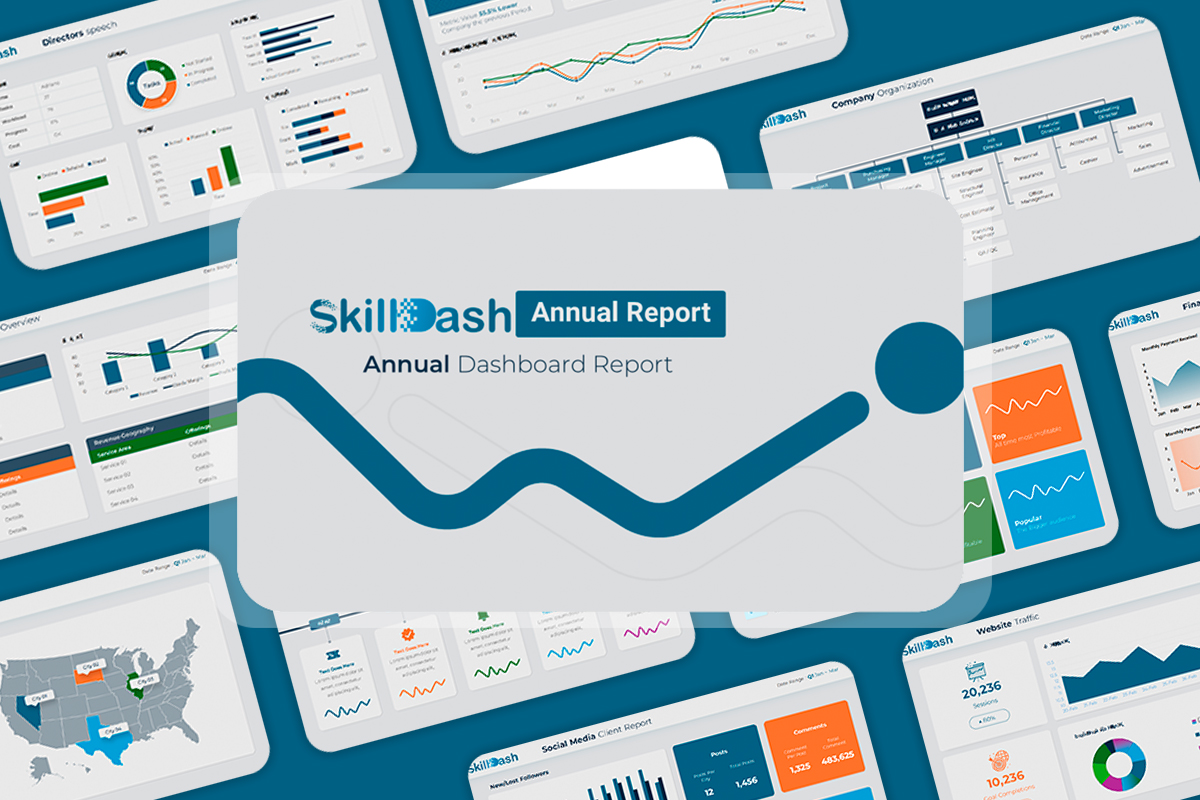
Elevate your data presentation game with the First Dashboard PowerPoint Template. This comprehensive collection of 30 slides provides a powerful framework to visualize and analyze key metrics, trends, and insights. Whether you’re tracking business performance, project progress, or marketing campaigns, this template empowers you to communicate your data effectively and make informed decisions.
Key Features:
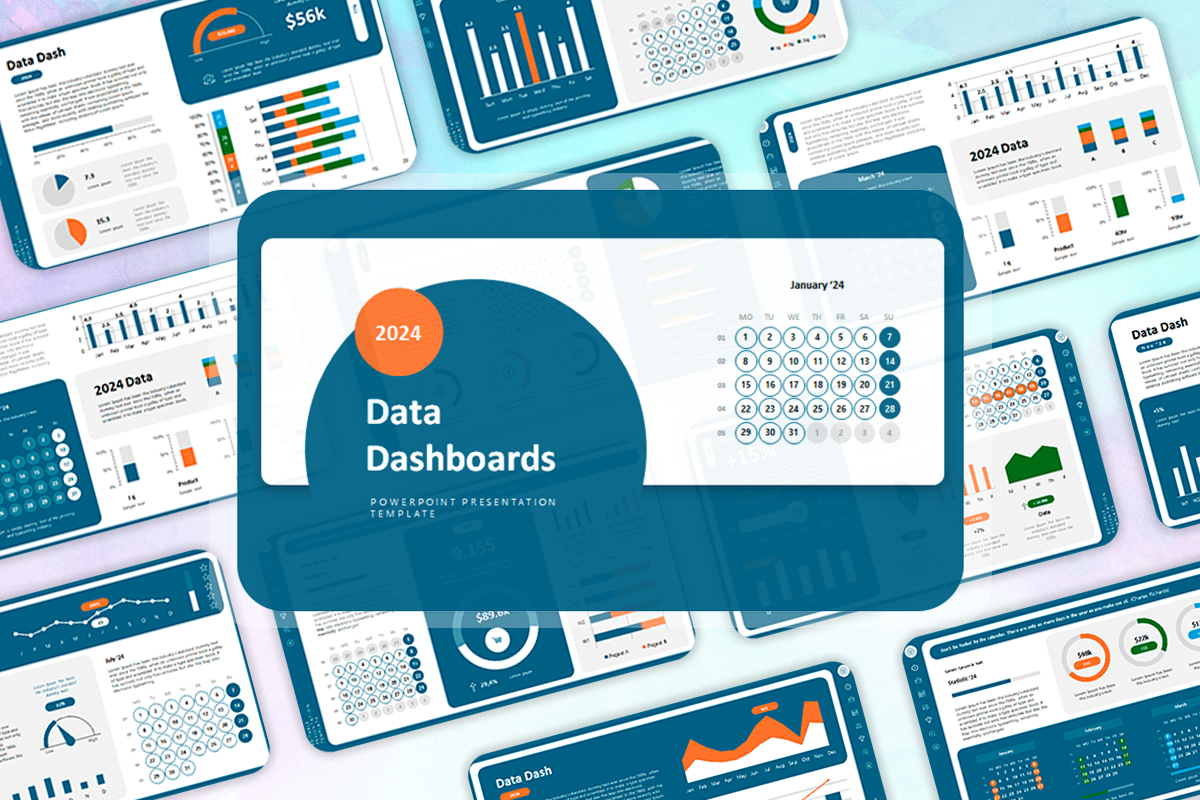
- 30 Informative Slides: A diverse array of customizable slides, including charts, graphs, tables, and infographics, to cater to your specific data visualization needs.
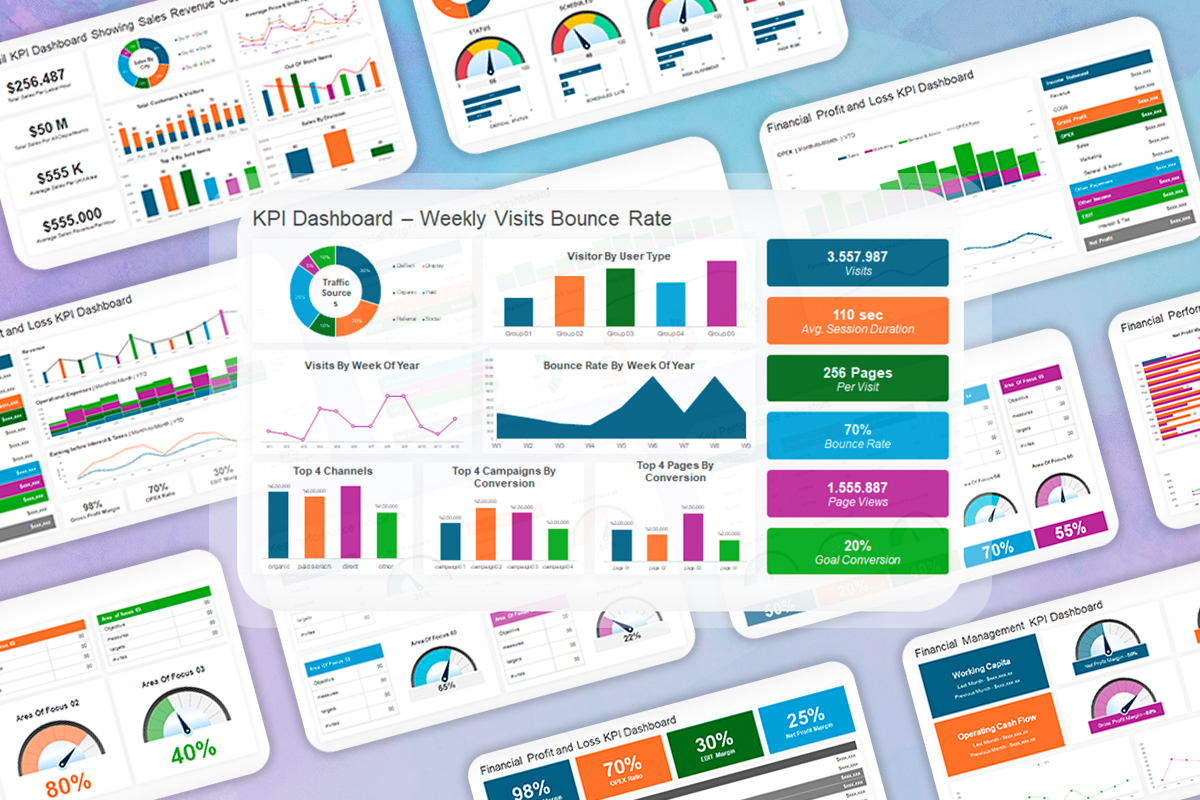
- Key Performance Indicators (KPIs): Track and display essential metrics at a glance.
- Data Comparison: Easily compare data sets over time or across different categories.
- Progress Tracking: Visualize progress towards goals and targets with intuitive charts.
- Customizable Layouts: Adapt the template to match your brand identity and presentation style.
- User-Friendly: No design skills required; simply input your data and watch it come to life.
Benefits:
- Clarity: Simplify complex data and make it easy for your audience to understand.
- Engagement: Captivate viewers with visually appealing and informative presentations.
- Decision-Making: Gain valuable insights into your data to drive informed decisions.
- Time-Saving: Eliminate the need to create data visualizations from scratch.
Ideal For:
- Business Professionals: Track sales, marketing, financial, and operational metrics.
- Project Managers: Monitor project progress, milestones, and resource allocation.
- Marketers: Analyze campaign performance and customer data.
- Educators: Present research findings and academic data in an engaging way.
All Image Stocks not included.
Related Products
From multipurpose themes to niche templates